
| Athens/Institutional login |
 |
||||

|
|
|||
| Journals Home | Journals List | EJs Extra | This Journal | Search | Authors | Referees | Librarians | User Options | Help | | ||||
| |
||||
This article's multimedia enhancements are given below. Each file carries a brief description and is also referred to at appropriate places in the main text of the article.
Help and further information on supplementary information in IOP Publishing's journals is available. Instructions on how to submit multimedia material are given in our Information for authors.

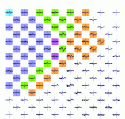
Supplementary figure 1. (30.4 KB, PDF) Examples of
trial-averaged movement-related potentials (MRPs) recorded in the
self-paced, four-direction center out task. MRPs are averaged over
trials with movements in all four directions for both session 1 and 2
of subject 1 (294 trials in total). For each recording channel, a
subplot is shown with time (from -2 sec to + 2 sec relative to movement
onset) on the x-axis and potential amplitude (from -2 to 2 mV) on the y-axis.
Colors correspond to the primary motor cortex (M1, orange), premotor
cortex (PM, green), prefrontal cortex (PF, blue), frontal eye field
(FEF, magenta) as in figure 1 of the paper. The cyan channel was used
as a reference channel for the amplifier but all signals analyzed in
this paper (including this figure) were re-referenced to a common
average reference (CAR). The time course of the CAR is shown at the
position of the original reference channels. Besides a baseline
correction using the first 200 ms of the time window, no further
pre-processing was applied to the data. Pronounced MRPs can be seen in
the M1 and PM channels.

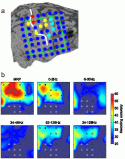
Supplementary figure 2. (89.0 KB, PDF) Grid position and
decoding maps in subject 2. (a) The grid position in this patient was
determined using the methods of curvilinear reconstructions as
described in Schulze-Bonhage et al (2002). The central sulcus
is marked in white. Red electrodes showed arm motor responses upon
direct cortical electrical stimulation, yellow electrodes hand motor
responses, and cyan electrodes eye motor responses, respectively. The
green dashed line indicates the area corresponding to the maps shown in
(b). These maps do not cover the full extent of the grid because they
were generated using a spatial sliding window (cf figure 2 of the
paper). (b) Maps of decoding accuracy following the conventions of
figure 4 of the paper.

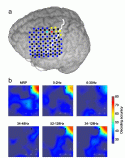
Supplementary figure 3. (174.0 KB, PDF) Grid position and
decoding maps in subject 3. (a) The grid position in this patient was
visualized using the method as described in Kovalev et al
(2005). Note that this patient had an unusually large brain. The
central sulcus is marked in white. Red electrodes showed arm motor
responses upon direct cortical electrical stimulation, yellow
electrodes hand motor responses, and cyan electrodes eye motor
responses, respectively. Black electrodes were not tested using
electrical stimulation mapping. (b) Maps of decoding accuracy following
the conventions of figure 4 of the paper. As in supplementary figure 2,
these maps do not cover the full extent of the grid.

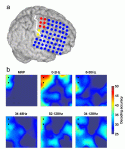
Supplementary figure 4. (215.0 KB, PDF) Grid position and decoding maps in subject 4. All conventions are as in supplementary figures 2 and 3.
References
Kovalev D, Spreer J, Honegger J, Zentner J, Schulze-Bonhage A, Huppertz
H J 2005 Rapid and fully automated visualization of subdural electrodes
in the presurgical evaluation of epilepsy patients Am. J. Neuroradiol. 26 1078-1083
Schulze-Bonhage A H, Huppertz H J, Comeau R M, Honegger J B, Spreer J M, Zentner J K 2002 Visualization of subdural strip and grid electrodes using curvilinear reformatting of 3D MR imaging data sets Am. J. Neuroradiol. 23 400-403
| |
|
|
Journals Home | Journals List | EJs Extra | This Journal | Search | Authors | Referees | Librarians | User Options | Help | Recommend this journal Use of this service is subject to compliance with the terms and conditions of use. In particular, reselling and systematic downloading of files is prohibited. Help: Cookies | Data Protection. |
|
 |